Data description
In this blog, we use the data from Data on COVID-19 (coronavirus) by Our World in Data. We applied 14 variables and 586 observations.
| variable | class | description |
|---|---|---|
| date | character | Date of observation |
| total_cases | numberic | Total confirmed cases of COVID-19 |
| new_cases | numberic | New confirmed cases of COVID-19 |
| total_cases_per_million | numberic | Total confirmed cases of COVID-19 per 1,000,000 people |
| new_cases_per_million | numberic | New confirmed cases of COVID-19 per 1,000,000 people |
| total_deaths | numberic | Total deaths attributed to COVID-19 |
| new_deaths | numberic | New deaths attributed to COVID-19 |
| total_deaths_per_million | numberic | Total deaths attributed to COVID-19 per 1,000,000 people |
| new_deaths_per_million | numberic | New deaths attributed to COVID-19 per 1,000,000 people |
| total_vaccinations | numberic | Total number of COVID-19 vaccination doses administered |
| people_vaccinated | numberic | Total number of people who received at least one vaccine dose |
| people_fully_vaccinated | numberic | Total number of people who received all doses prescribed by the vaccination protocol |
| new_vaccinations | numberic | New COVID-19 vaccination doses administered (only calculated for consecutive days) |
| population | numberic | Population in 2020 |
COVID-19 Cases Confirmed Summary
In the daily COVID-19 cases confirmed table, there is a surprising finding. The number of new cases in 03Jun 2020 and 24July 2021 is Negative. This situation may be caused by an error in the previous test result, or other reasons. The data is limited, so that no in-depth analysis will be done in this blog.
COVID-19 Deaths Summary
In the COVID-19 Deaths table, there is the same finding as well. The number of new death in the 24July 2020 is negative. This may be a duplicate record when the new death cases were counted previously, or the cause of death was not COVID-19.
COVID-19 Cases Confirmed and Death Summary
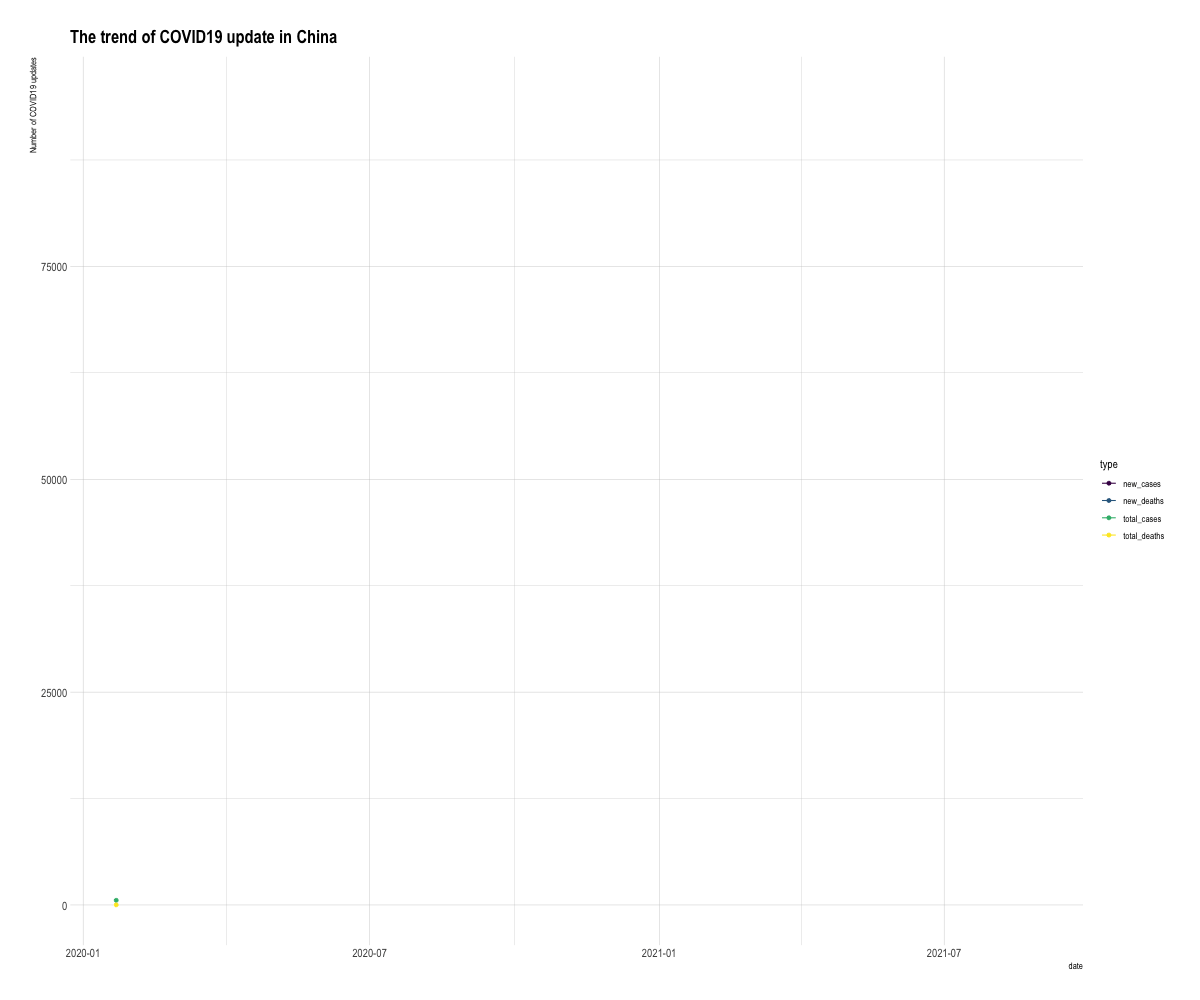
In order to show the trend of the COVID-19 Cases Confirmed and Death in China from 22Jan 2020 to 30Aug 2021, we do the plot in this blog.
Vaccination Status Summary
We can see the People Vaccinated Ratio is 0.77168 and Fully Vaccinated Rate is 0.61586. The mean of the daily new vaccinations is 12276031.
| Vaccinations Status of China | |||
|---|---|---|---|
| Chinese Vaccinations Status from 15Dec 2020 to 30Aug 2021 | |||
| Total Vaccinations | People Vaccinated Ratio | Fully Vaccinated Ratio | Daily New Vaccinations |
| 2044625000 | 0.7716816 | 0.6158628 | 12276031 |
Reference
Bob Rudis (2020). hrbrthemes: Additional Themes, Theme Components and Utilities for ‘ggplot2’. R package version 0.8.0. https://CRAN.R-project.org/package=hrbrthemes
H. Wickham. ggplot2: Elegant Graphics for Data Analysis. Springer-Verlag New York, 2016.
Hadley Wickham and Jim Hester (2020). readr: Read Rectangular Text Data. R package version 1.4.0. https://CRAN.R-project.org/package=readr
Hao Zhu (2021). kableExtra: Construct Complex Table with ‘kable’ and Pipe Syntax. R package version 1.3.4. https://CRAN.R-project.org/package=kableExtra
Richard Iannone, Joe Cheng and Barret Schloerke (2021). gt: Easily Create Presentation-Ready Display Tables. R package version 0.3.1. https://CRAN.R-project.org/package=gt
Simon Garnier (2018). viridis: Default Color Maps from ‘matplotlib’. R package version 0.5.1. https://CRAN.R-project.org/package=viridis
Thomas Lin Pedersen and David Robinson (2020). gganimate: A Grammar of Animated Graphics. R package version 1.0.7. https://CRAN.R-project.org/package=gganimate
Wickham et al., (2019). Welcome to the tidyverse. Journal of Open Source Software, 4(43), 1686, https://doi.org/10.21105/joss.01686
Yihui Xie, Joe Cheng and Xianying Tan (2021). DT: A Wrapper of the JavaScript Library ‘DataTables’. R package version 0.18. https://CRAN.R-project.org/package=DT